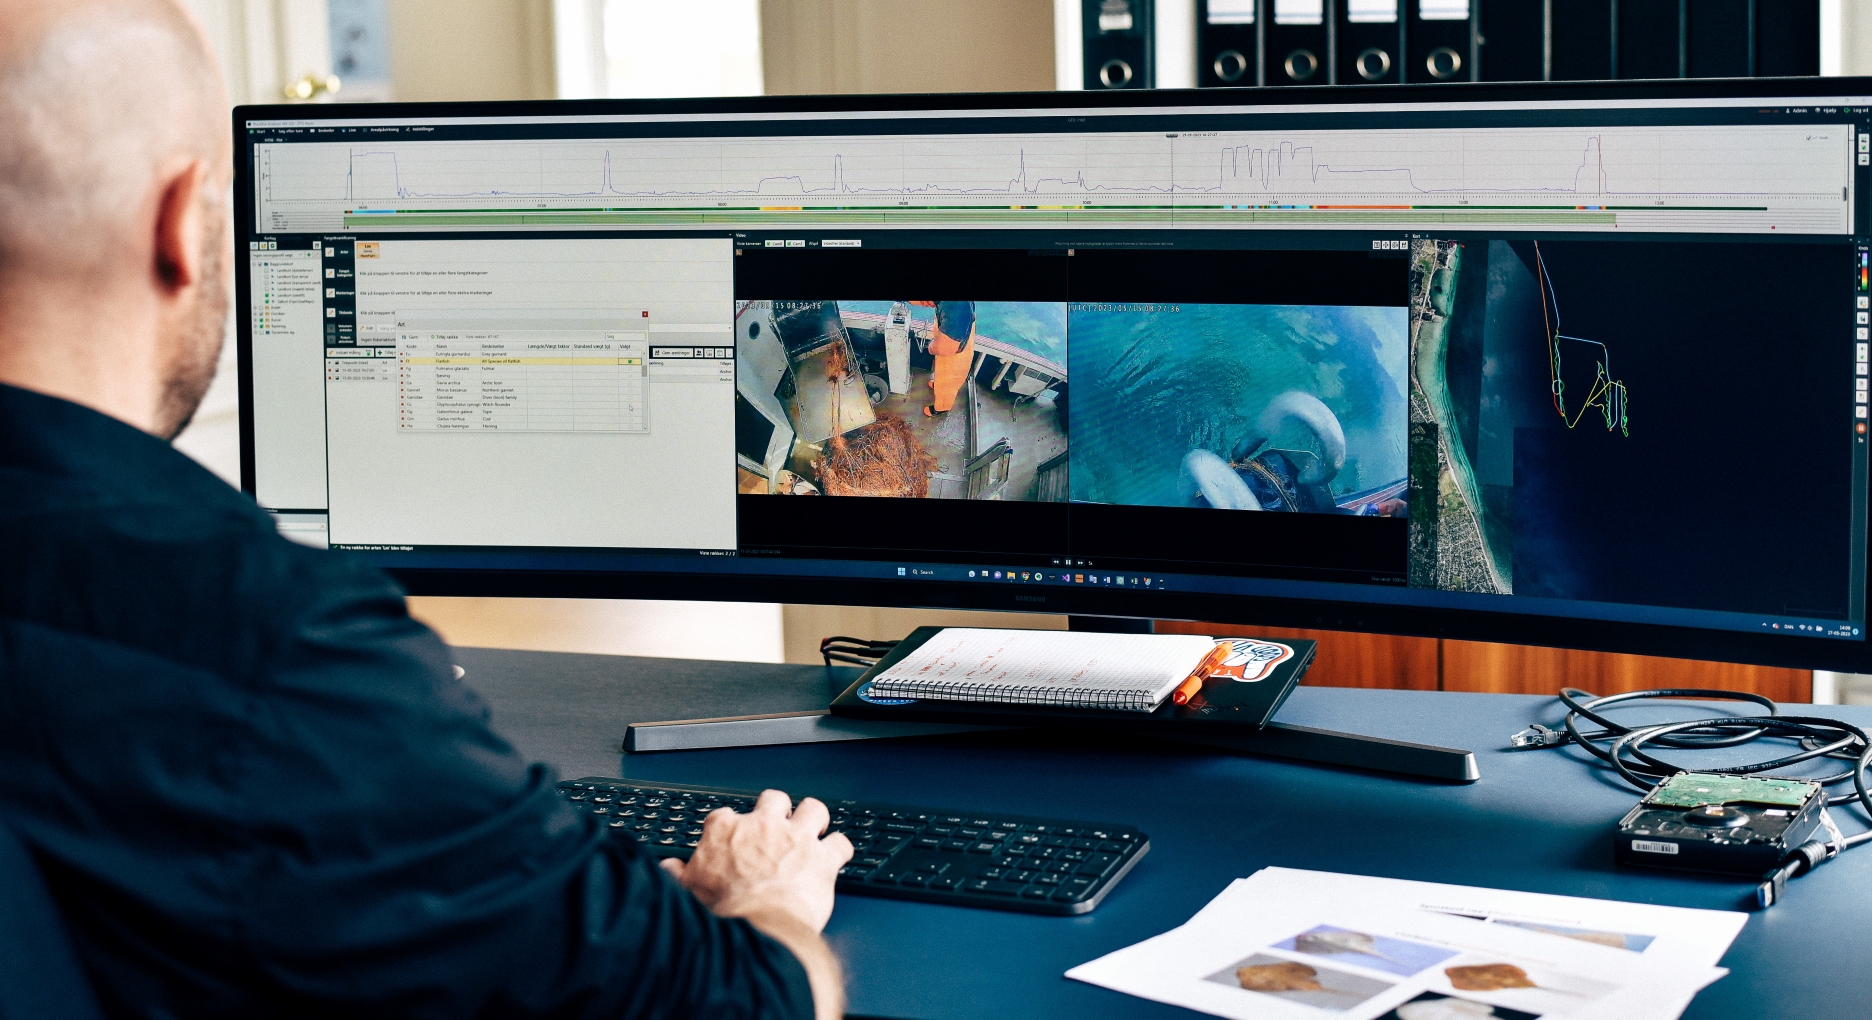
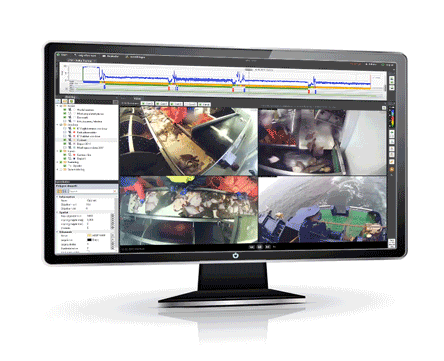
A strong data presentation system has been developed to enhance the visualisation and analysis of data from REM systems, particularly in conjunction with Anchor Lab's Black Box Systems. This system offers comprehensive tools for reviewing and interpreting the data, including integrated video playback that allows users to observe fishing locations and analyse sensor data alongside the captured video. Furthermore, users can conveniently access vessel information and track the status of uploaded data, enabling them to plan the necessary review workload and determine the quantity of data to be analysed.
Additionally, the system provides additional functionalities for managing, configuring, and troubleshooting Black Box Video systems. We continuously strive to enhance and expand the capabilities of our systems, and we welcome discussions on how we can further support the work of our users.
All uploaded vessel sensor data is accessible from the central data store, this enables the review of both recent and historical fishing trips.
The vessel list shows when each vessel last uploaded data to the store, while the vessel overview highlights when fishing trips occurred, and if video data is available for the trip.
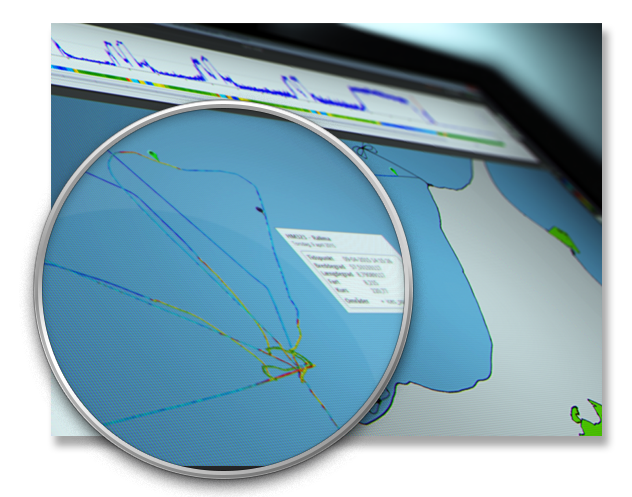
The Live Map feature shows the latest position and status information for a vessel over the last 24 hours. To provide a fleet-wide overview of which vessels are in harbour and which are out fishing
All uploaded vessel sensor data is accessible from the central data store, this enables an easy review of both recent and historical entries.
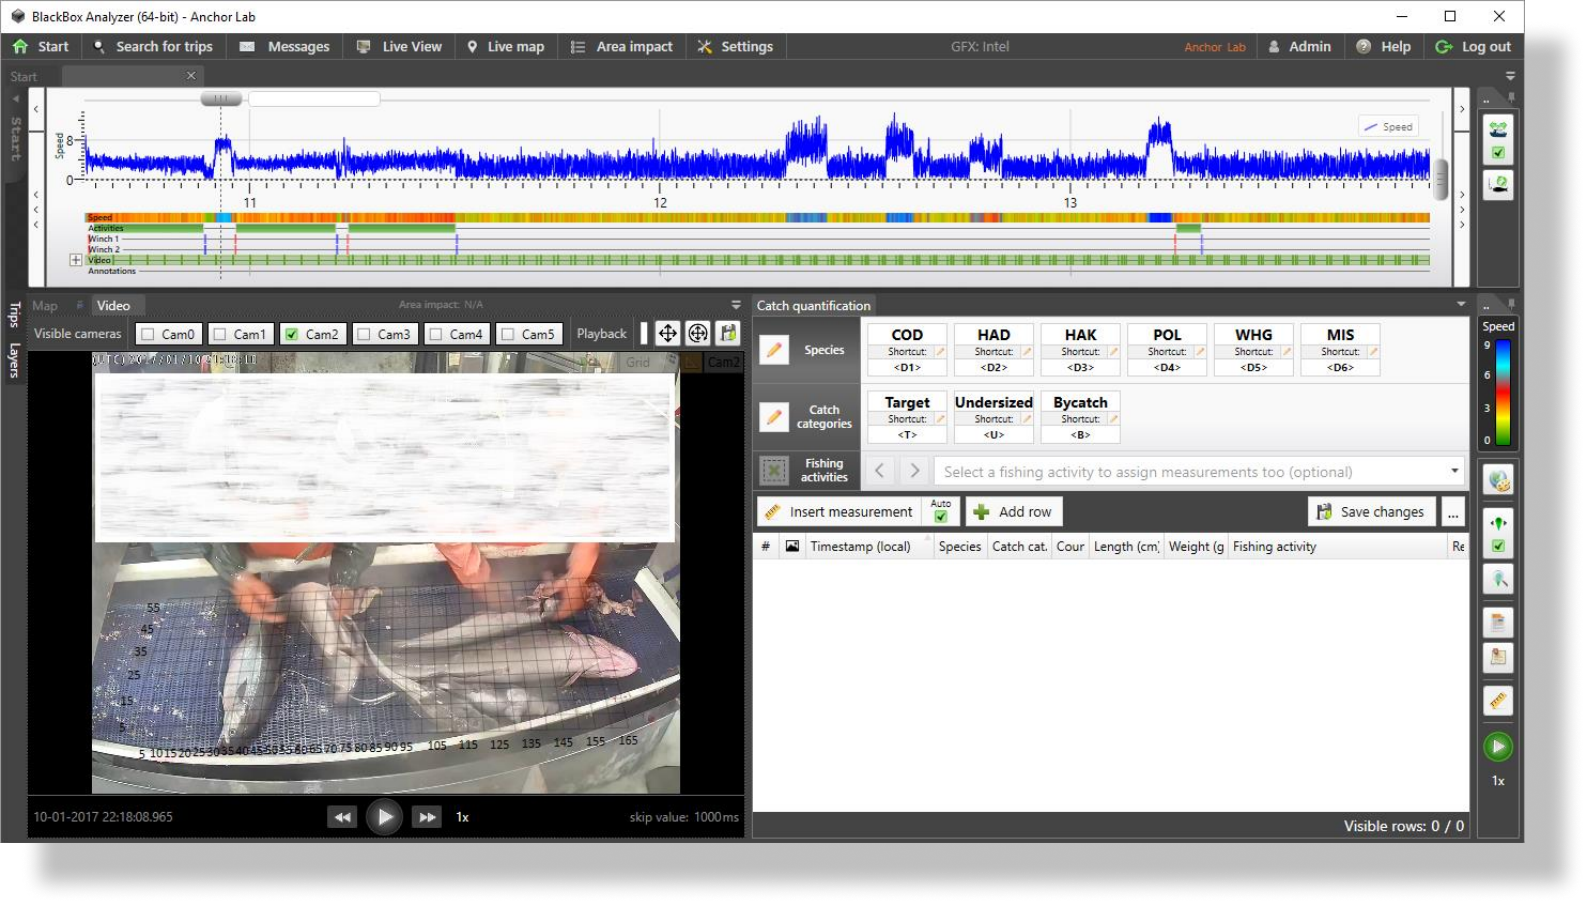
The graph visualises the data gathered during a trip along with associated information, such as estimated fishing activities, where the video was recorded, and its availability for review.
Play back the synchronised video feeds at different speeds, zoom in on target areas in the video, and use the keyboard shortcuts to pause, skip and play.
Video playback is integrated with the graph and the map, and the availability of recorded video is shown within the graph.
While reviewing the recorded video the cursor on the graph and map is updated to indicate the current location of the fishing vessel and the data captured at that point.
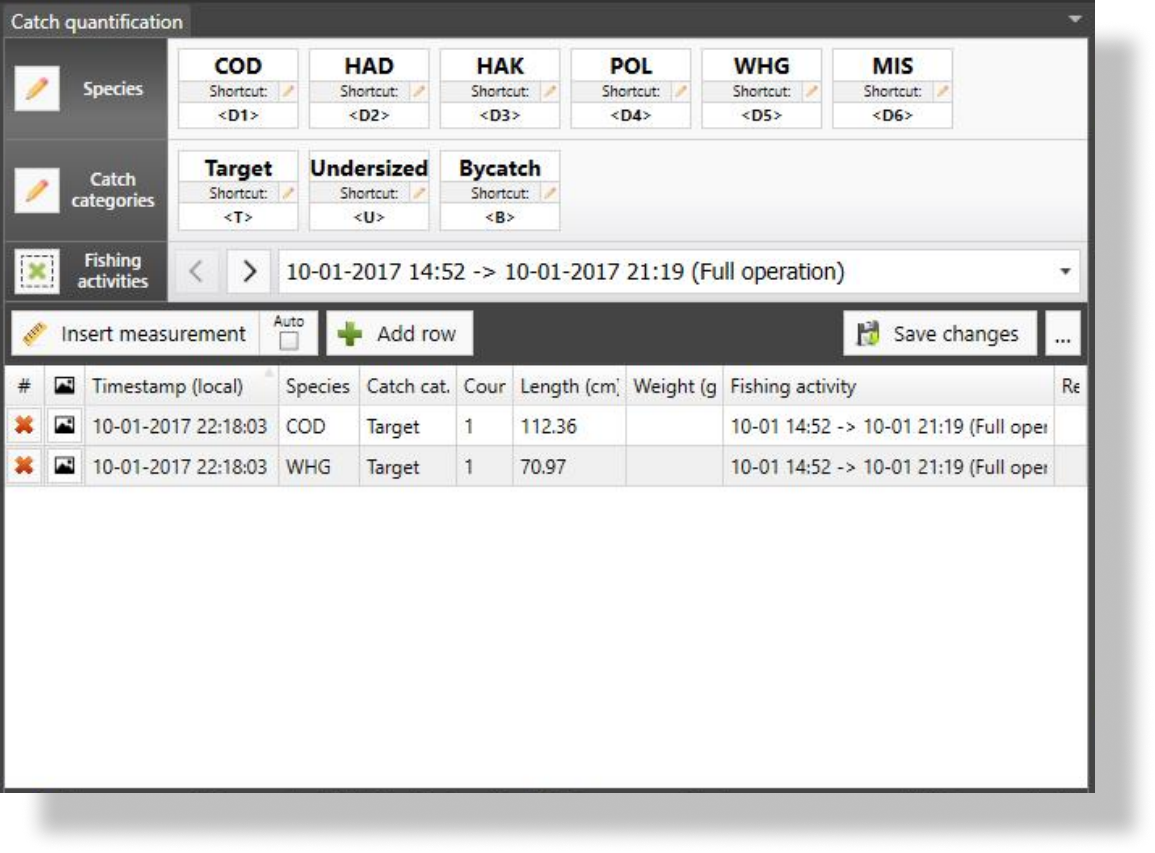
The Ccatch quantification module enables users to perform semi-automated measurements, species identification, and annotation tasks directly within the Black Box Analyzer.
The module is constantly being developed and can be tailored to specific user needs or use cases.
Users can create measurements on Analyzer with two different approaches:
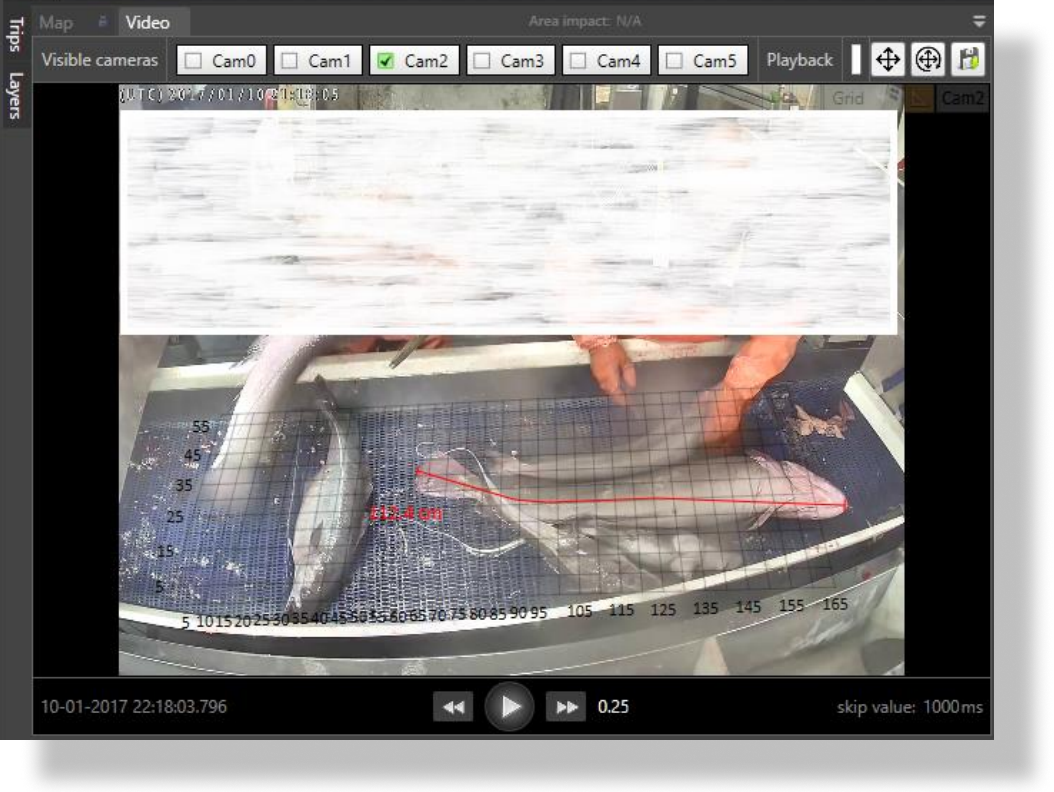
It is possible to save image snapshots of each measurement made. Information about recorded measurements is encoded into the image.
Validation of the accuracy (0.85% mean relative error and 4.1mm typical error) of measurements taken by the photogrammetric measuring grid in the BlackBox Analyzer can be reviewed here.
The catch quantification module is commonly used for species identification, especially for registering endangered species encounters. Users can make a measurement which includes a snapshot image, species code, catch type (target, discard, bycatch, etc.) and leave a remark.
Additional information data fields can be easily implemented according to user needs.
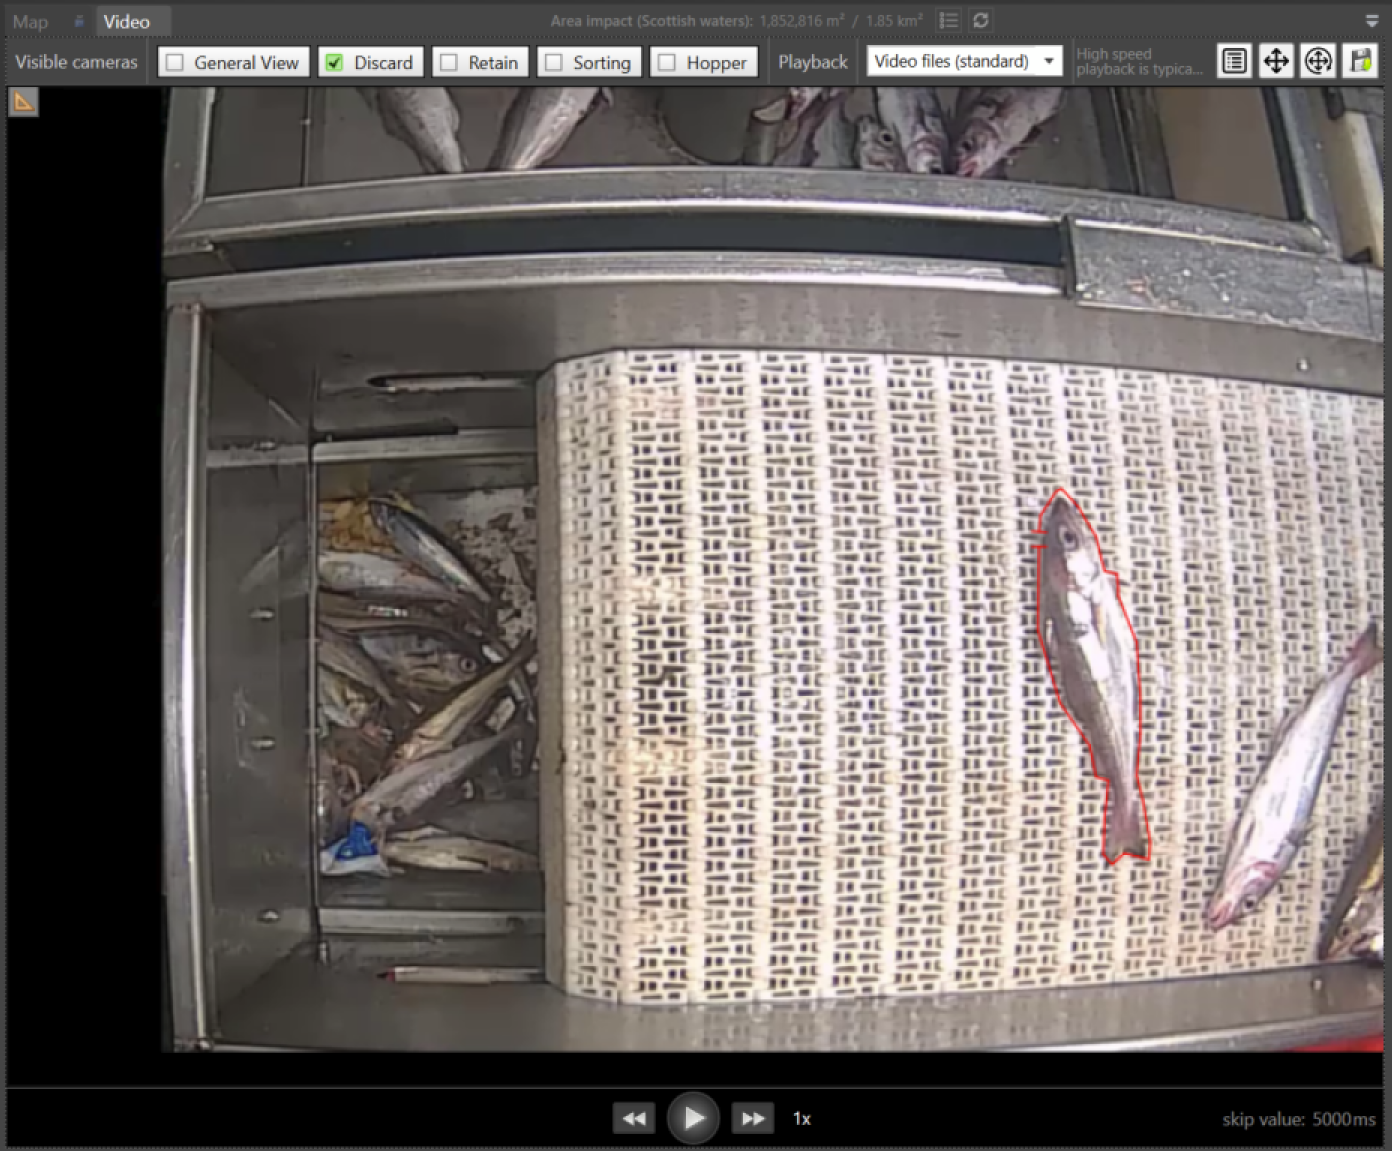
The latest addition to the catch quantification module is annotation export for AI model training.
Users can now annotate images directly on Black Box Analyzer using a polyline or a box measurement tool. Image snapshots and annotation data can be exported to a specified location.
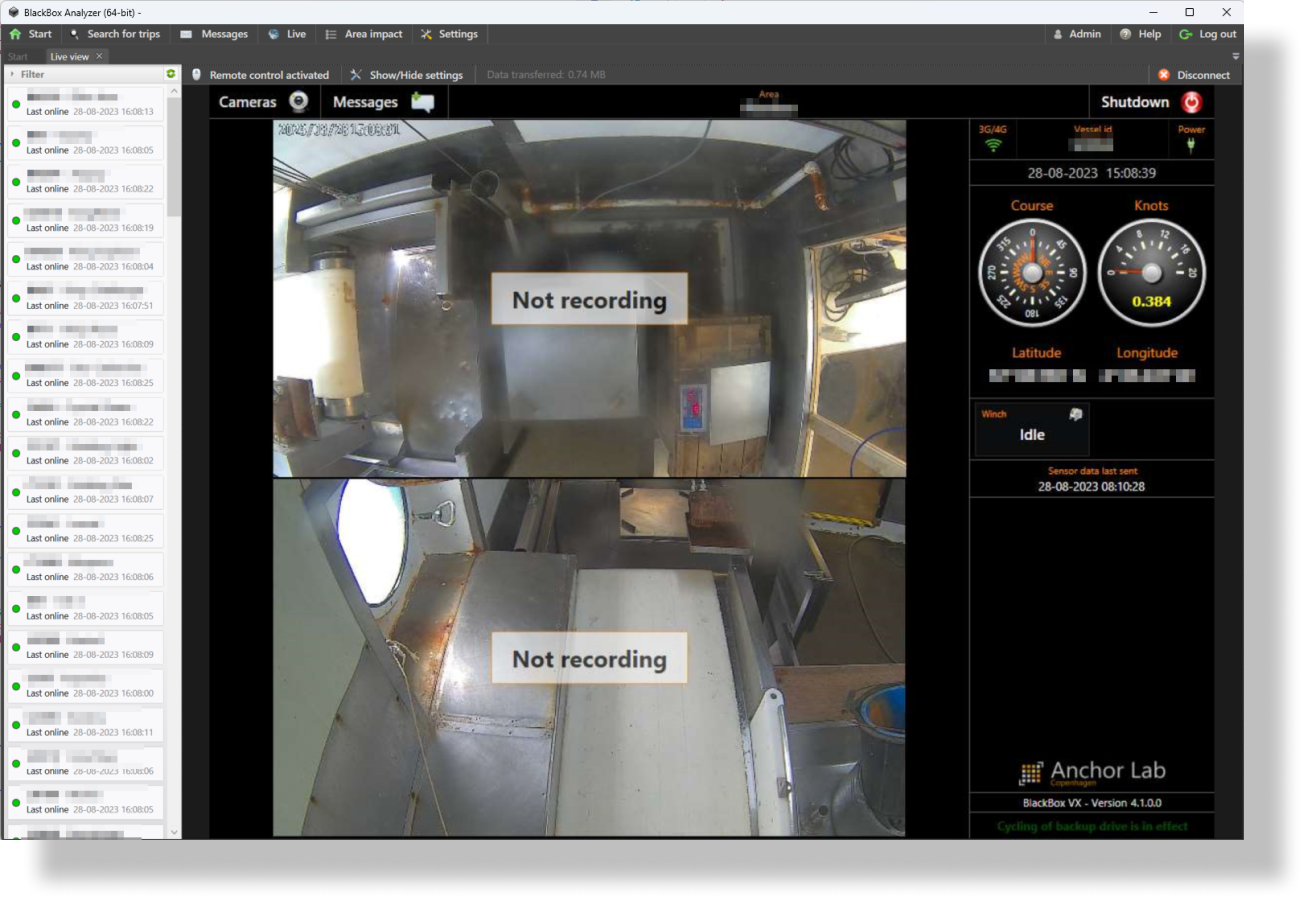
Incorporated into the Analyzer is a secure remote access tool to remotely control individual Black Box Video systems in the field.
This provides the ability to check, configure or troubleshoot how systems are performing, including the ability to alter video recording parameters (quality, resolution, frame rate, etc.) and the administrative settings for the system.
Additionally, system setting changes can easily be applied to an entire fleet of vessels.
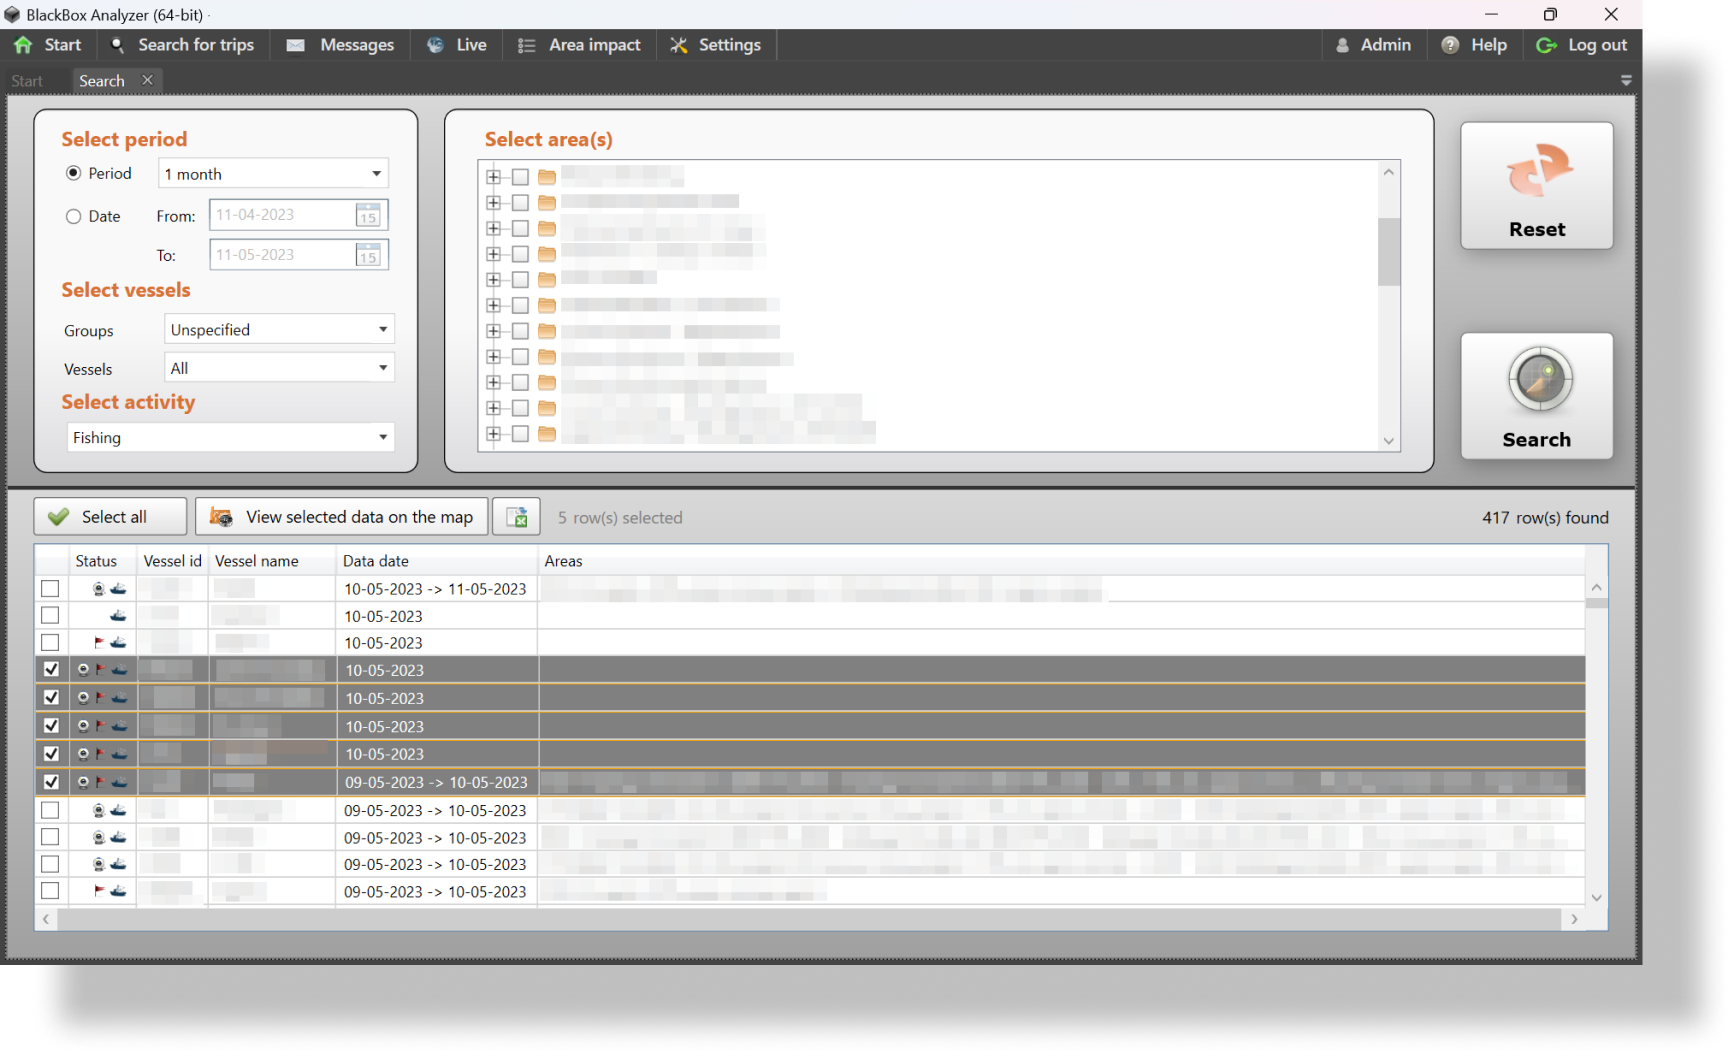
The search for trips feature enables a user to search for fishing trips based on various criteria, including by vessel and/or vessel group, date period or date range and/or by specific area(s). Multiple trips from multiple vessels can be analysed at once via the built-in data visualisation and video playback features.
All types of data, including raw sensor data, fishing activities, notes, catch quantification entries, and annotations can be exported for all selected trips.
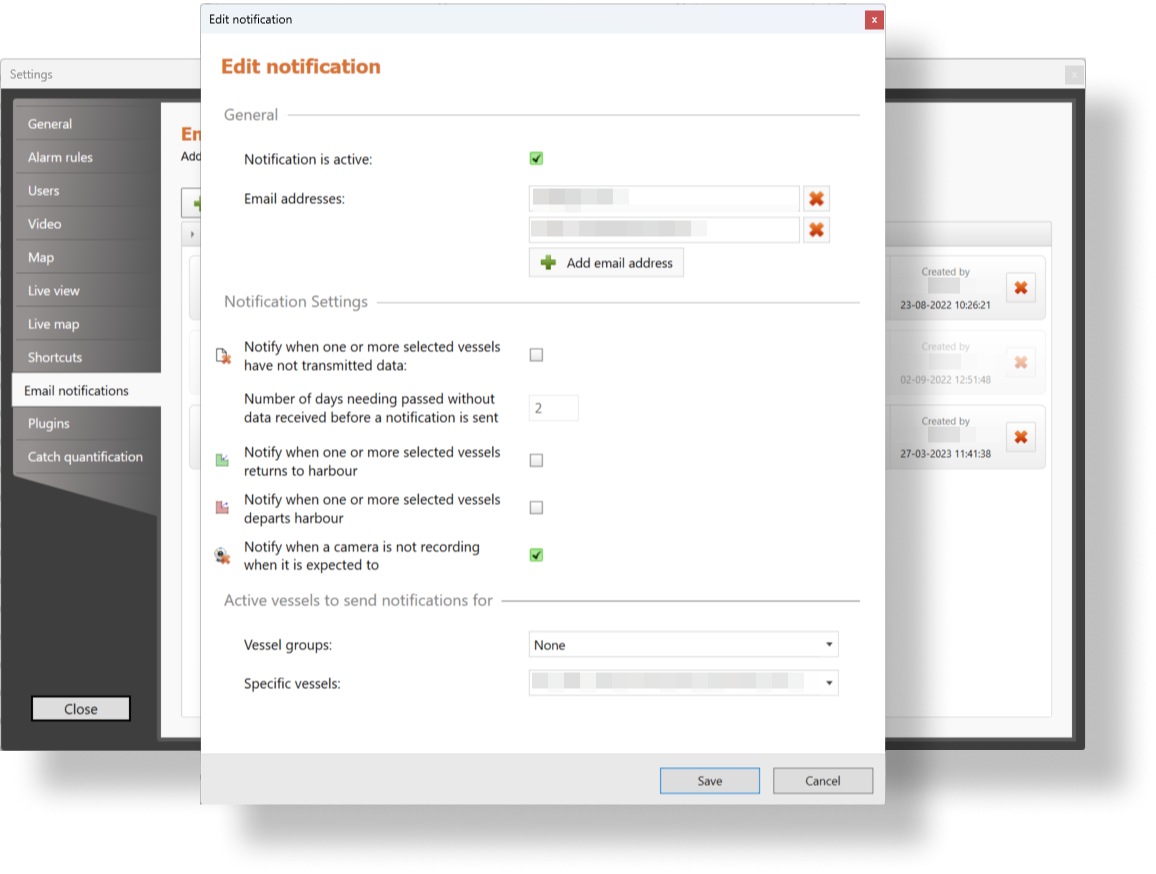
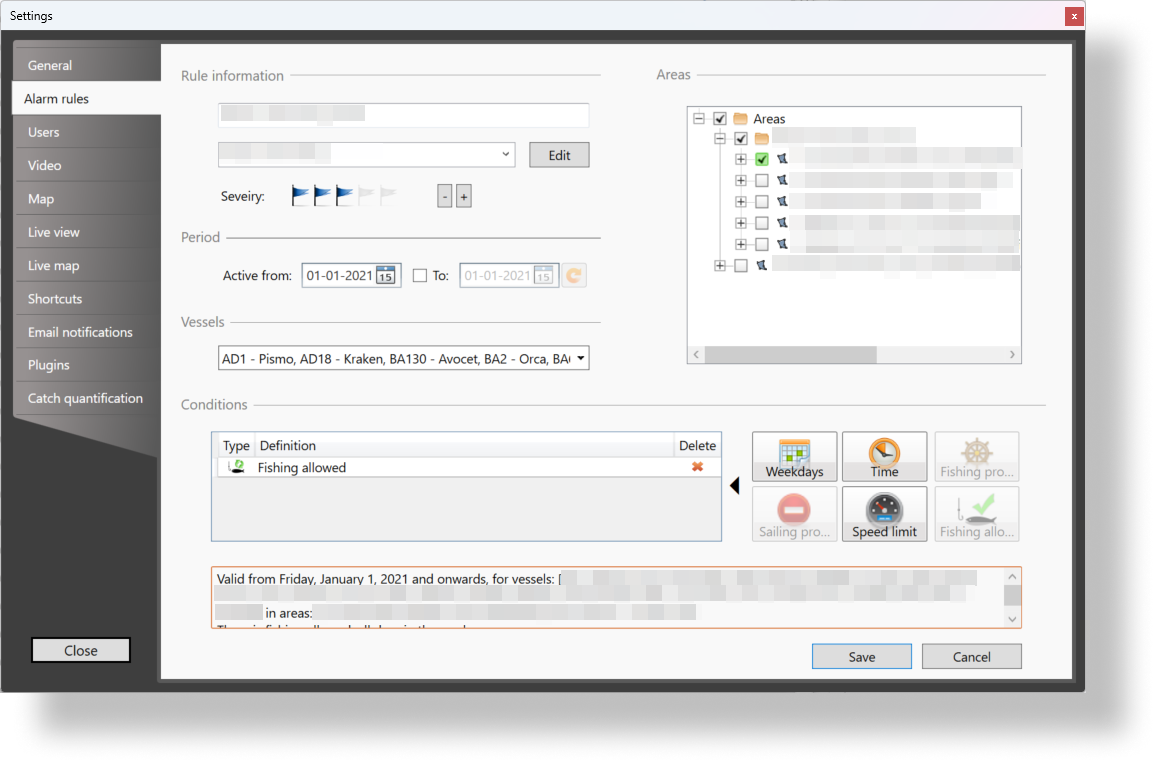
A rules system can flag (highlight) fishing trips based on certain criteria such as exceeding local speed limits, fishing outside of normal fishing hours, fishing inside/outside designated fishing grounds. Rules can be added and defined directly through the Black Box Analyzer user interface and can apply to individual vessels or vessel groups.
Rules can be useful to aid the prioritisation of fishing trips to review based on risk assessment criteria while notifications can provide insight into the operational status of individual systems. Email notifications can be configured to provide status updates of vessels, such as entering/leaving harbour, system performance indicators among others.
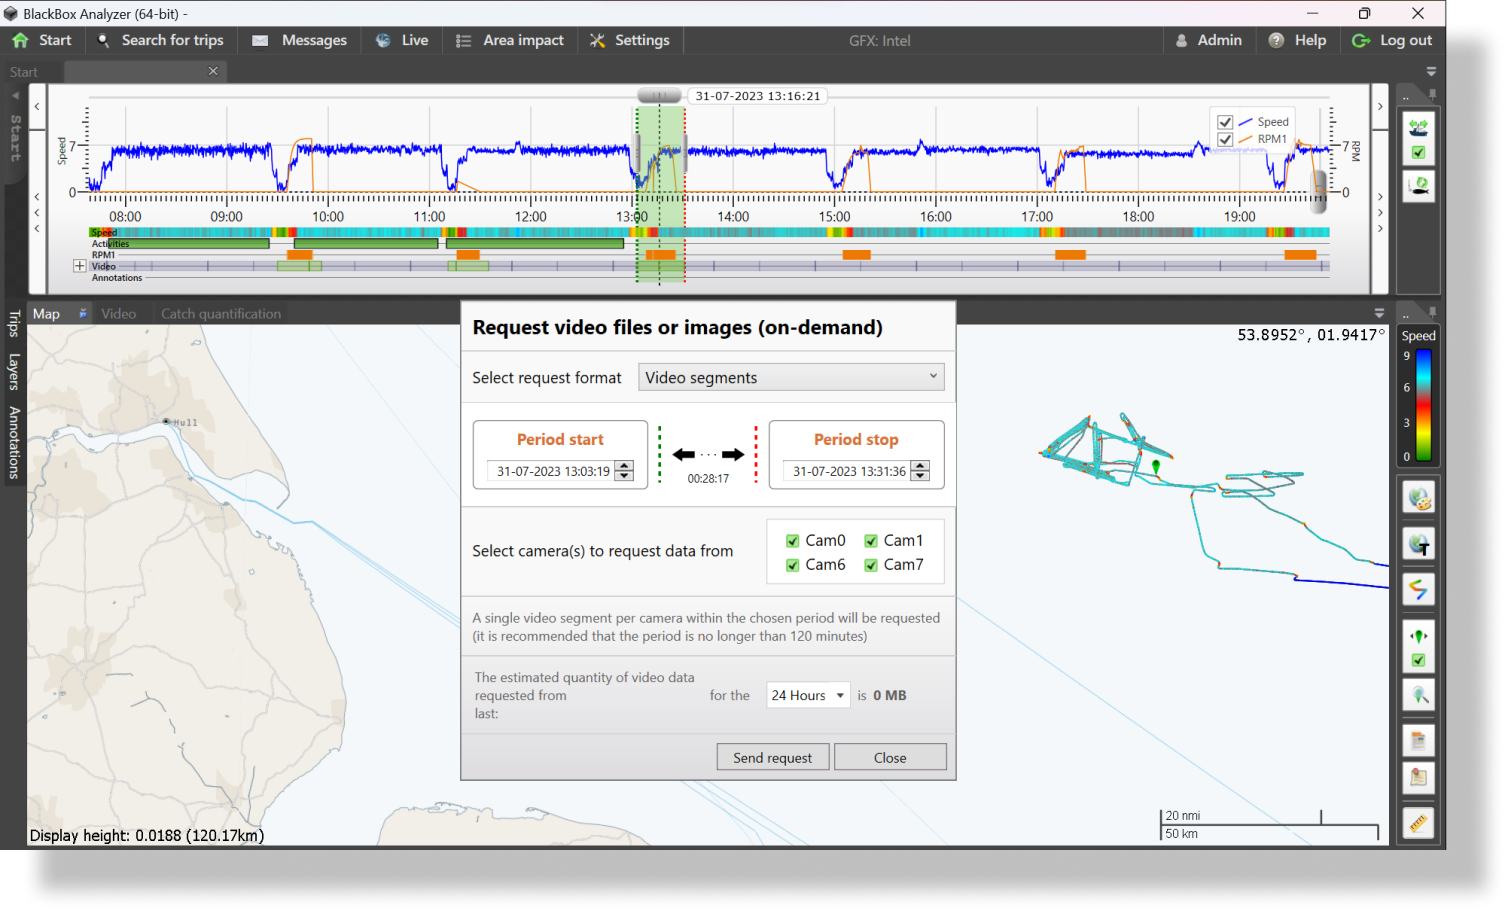
The Black Box ecosystem is designed to provide real-time or near real-time access to collected data. It is crucial to have the ability to access video data as needed for reviewing purposes. The Black Box Video system offers various methods to upload video data, such as uploading all collected video, uploading a specific subset of video data, or uploading still images extracted from the collected video.
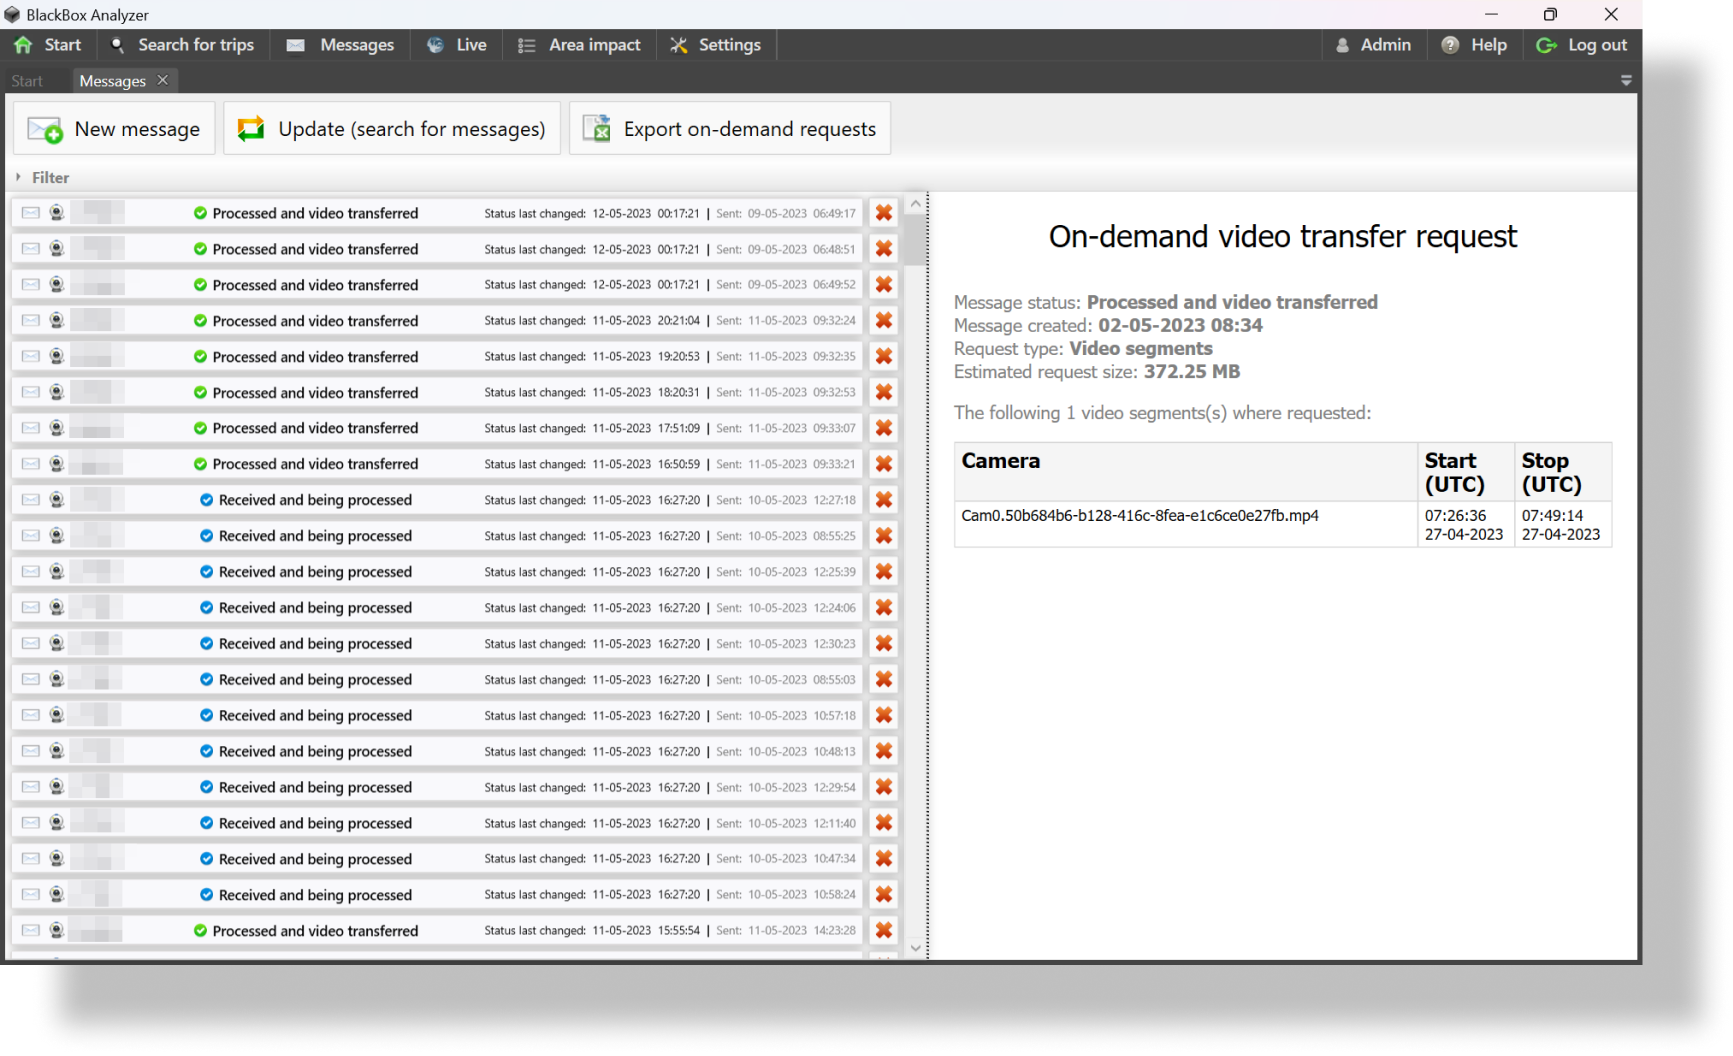
Using the Video On-Demand feature in the Black Box Analyzer, one can effectively manage which video data is uploaded from each vessel. This feature allows the optimization of data bandwidth usage by selectively uploading only the video data related to fishing activities that require review.
The messaging system enables messages and feedback reports to be sent to individual or multiple vessels directly from the Black Box Analyzer. High priority messages are displayed on the Black Box Video screen on the vessel until they are acknowledged.
Message status is tracked and displayed in the Analyzer so users can see whether a message has been delivered and if it has been acknowledged.
The messaging system is also used to track the status of video on-demand requests, tracking when they were sent, the status of the request (being processed/completed), and when the processing of a request was completed.